Major North American stock benchmarks closed in correction territory on Friday, November 20, 2026, after a sharp sell-off in artificial intelligence and semiconductor shares dragged the S&P 500 down 3.7 per cent to 6,910.39. The Dow Jones Industrial Average fell 1.9 per cent to 48,147.33, while the Nasdaq Composite sank 5.3 per cent to 22,617.73, wiping out its gains for the year. For Canadian investors holding U.S. equities through RRSPs, TFSAs, and index funds, the rout marks the steepest weekly market pullback since April 2025.

What Changed
Both the S&P 500 and the Dow Jones Industrial Average ended Friday more than 10 per cent below their October 6 record closing highs, meeting the technical definition of a market correction. The S&P 500 has now fallen for seven consecutive trading sessions, its longest losing streak since February 2020, while the Nasdaq Composite posted a 10 per cent weekly drop—its worst week since March 2020.
The selling accelerated after artificial intelligence stocks and chipmakers reversed sharply following Anthropic's initial public offering. After debuting on Thursday at US$83 per share and briefly climbing above US$115, Anthropic shares tumbled 9.1 per cent on Friday to close between US$88.30 and US$88.91, roughly 23 per cent below their intraday peak.
- Nvidia: Dropped nearly 14 per cent on Friday following reports that the U.S. Securities and Exchange Commission is probing its accounting, leaving the chipmaker down almost 40 per cent in November after former CEO Jensen Huang resigned earlier this month.
- Semiconductors: The PHLX Semiconductor Index sank 10.7 per cent, pulled down by double-digit losses in Micron Technology (13.9 per cent), Advanced Micro Devices (13.3 per cent), and Broadcom (12.1 per cent).
- AI Infrastructure: Data centre operator CoreWeave dropped over 10 per cent on Friday and sits 71 per cent off its peak, while Bloom Energy lost 15.3 per cent and Corning fell 10.9 per cent.
- Market Correction
- A decline of 10 per cent or more in a stock index from its most recent record closing high.
- 200-Day Moving Average
- A technical indicator tracking an index's average closing price over the past 200 trading days, used by institutional traders to gauge long-term trend direction.
- Commodity Trading Advisors (CTAs)
- Automated and systematic fund managers that trigger buy or sell orders when market prices cross key technical trend lines.
Who Is Affected
Everyday savers and retirement investors with exposure to broad U.S. equity benchmarks or technology-heavy exchange-traded funds bear the most immediate impact. Because mega-cap technology and AI companies carry heavy weightings inside the S&P 500 and Nasdaq, declines in a handful of semiconductor and cloud stocks pull down overall index values even when defensive sectors hold steady.
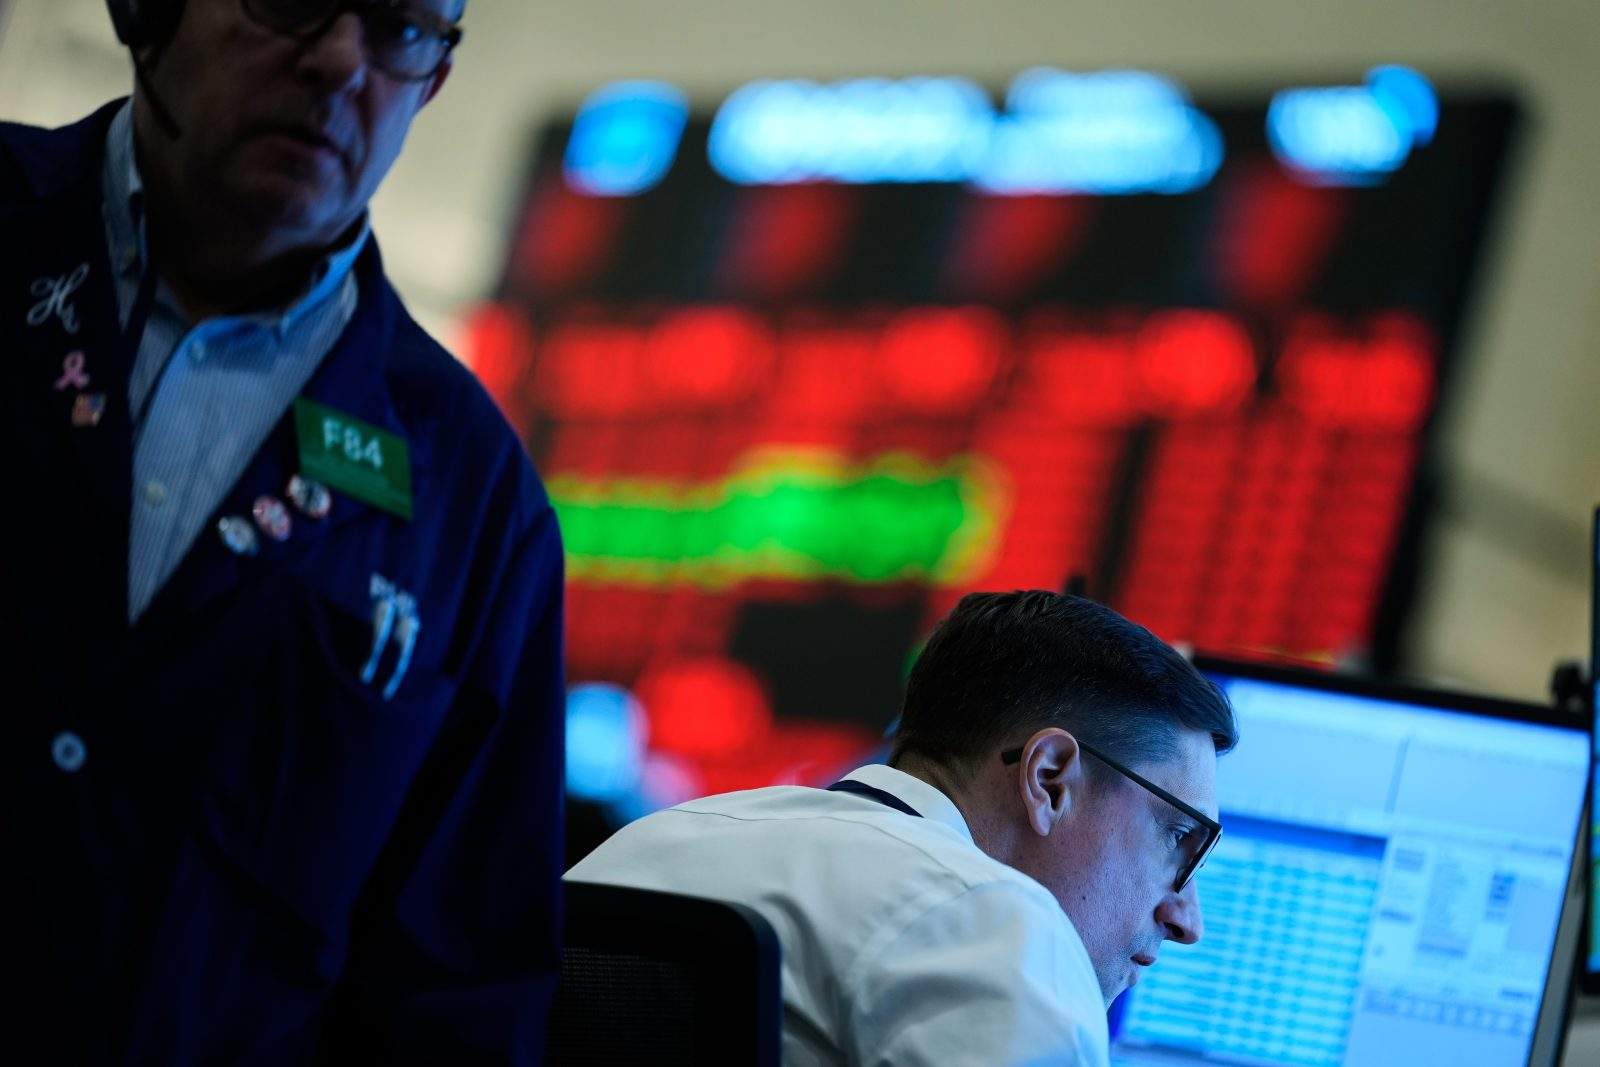
Meanwhile, investors holding non-technology shares saw a starkly different session. Consumer staples and housing stocks gained ground on Friday, with General Mills rising 3.7 per cent, Lennar adding 1 per cent, and healthcare stocks edging up 0.8 per cent.
The whole notion that AI can continue to spend unlimited amounts of money and support the stock market, I think the notion of that is ending as we speak, that’s what’s being priced right now.
What It Means for Your Money
A 10 per cent correction erases recent paper gains on brokerage statements, bringing the S&P 500 down to roughly a 1 per cent gain for 2026 after annual returns exceeding 20 per cent in 2023 and 2024 and 16 per cent in 2025. For example, a $50,000 portfolio tracking the S&P 500 from its October 6 peak would now sit closer to $45,000 before accounting for currency fluctuations between the Canadian and U.S. dollars.

When the S&P 500 broke below its 200-day moving average on Thursday, automated CTA funds triggered systematic selling that amplified daily price swings. Wharton professor Jeremy Siegel noted on CNBC's market coverage that long-term historical stock returns average 8 per cent to 9 per cent annually, suggesting the pullback is resetting inflated expectations rather than signaling an economic collapse.
The Wider Economic Context
Beyond tech valuations, shifting interest rate expectations and geopolitical tension are pressuring North American equities. Persistent inflation far above the U.S. Federal Reserve's 2 per cent target—aggravated by oil prices above US$83 a barrel and Brent crude at US$92.57 amid the ongoing U.S.-Iran conflict and Strait of Hormuz transit fees—has pushed central bank officials toward tighter monetary policy.
Federal Reserve Governors Christopher Waller and Lisa Cook warned this week that current interest rates are not high enough to contain price pressures, prompting bond markets to price in a 98.2 per cent probability of a December rate hike. At the same time, Democratic victories in recent U.S. midterm elections have raised the prospect of stricter federal and state regulations on energy-intensive AI data centre construction, adding another headwind to the sector's growth outlook.
Important Dates and Next Steps
Investors watching for signs of stabilization face several key economic and policy milestones over the coming weeks:
- Next week: Release of the U.S. personal consumption expenditures (PCE) inflation report, which will shape interest rate expectations following October's hotter-than-expected inflation reading.
- December 2026 Federal Reserve meeting: Policymakers decide whether to resume interest rate hikes, with Waller raising the possibility of a half-percentage-point increase.
- January 2027 Federal Reserve meeting: Markets are currently pricing in the potential for a second consecutive rate increase if inflation remains elevated.
Frequently Asked Questions
Why did the stock market drop so sharply on November 20, 2026?
The S&P 500 fell 3.7 per cent and the Nasdaq dropped 5.3 per cent as investors sold off artificial intelligence and semiconductor stocks following Anthropic's post-IPO retreat and a 14 per cent plunge in Nvidia. Technical selling triggered by the S&P 500 falling below its 200-day moving average, alongside expectations of a December U.S. Federal Reserve rate hike, compounded the decline.
What does it mean that the S&P 500 is in a correction?
A market correction occurs when an index drops 10 per cent or more from its most recent record closing high. Both the S&P 500 and the Dow Jones Industrial Average crossed that threshold on November 20, 2026, pulling back from their October 6 peaks for the first time since March 2025.
Why is Nvidia stock falling right now?
Nvidia shares dropped nearly 14 per cent on Friday after reports surfaced that the U.S. Securities and Exchange Commission is investigating the company's accounting. The stock has lost almost 40 per cent in November following the resignation of former CEO Jensen Huang, tighter U.S. chip export rules to China, and broader doubts over AI spending.
Will the U.S. Federal Reserve raise interest rates in December 2026?
Financial markets are pricing in a 98.2 per cent chance of an interest rate hike at the Federal Reserve's December meeting, according to CME Group's FedWatch tool. Fed Governors Christopher Waller and Lisa Cook both warned this week that inflation remains too high, with Waller suggesting a half-percentage-point hike may be needed.