

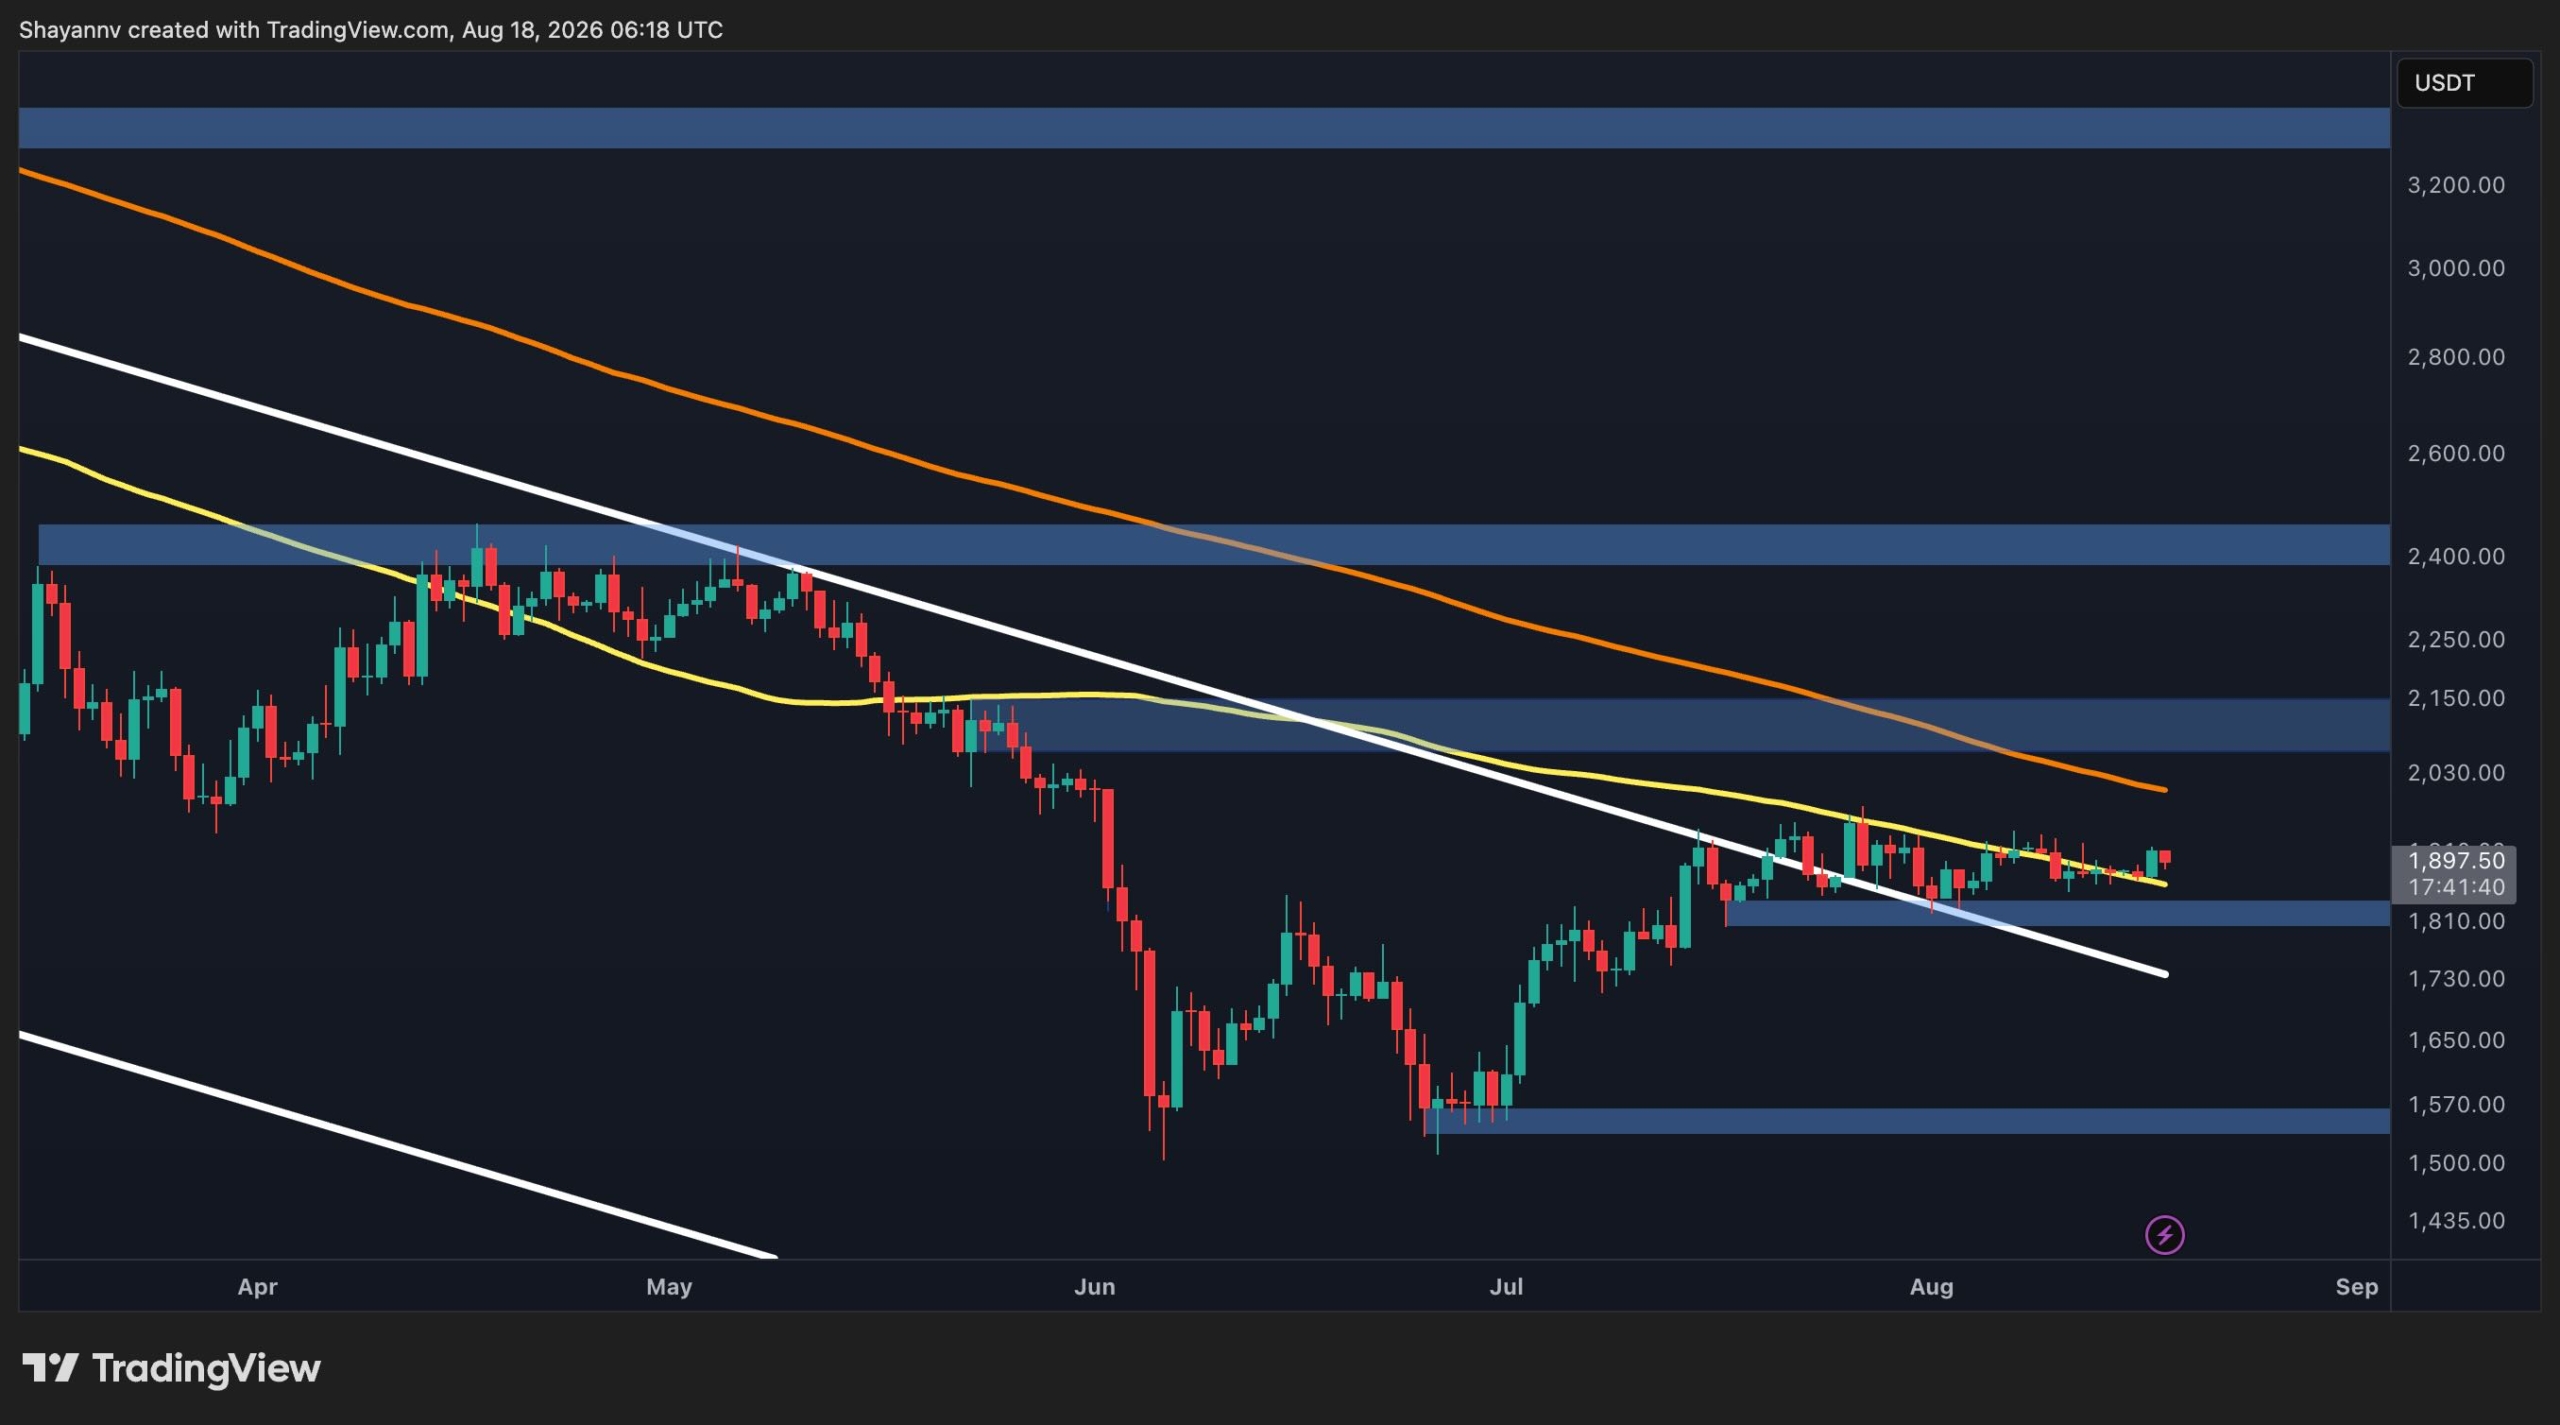
Ethereum traded near $1,919 on August 19, 2026, marking a 3% intraday gain after touching a session peak of $1,930 on Binance. For crypto investors in the United States, the second-largest digital asset by market capitalization is navigating a narrow trading corridor between established support at $1,850 and heavy technical resistance at $1,986. The price movement follows months of range-bound activity as spot exchange-traded fund activity and institutional balance-sheet accumulation test supply availability.

What People Are Searching For
Traders and market participants are searching to determine whether Ethereum's recent lift from its August 17 low of $1,870 represents a genuine trend breakout or an unsustainable bull trap. Search queries focus heavily on whether ETH can clear the psychological $2,000 threshold and whether institutional staking applications could trigger sustained spot demand. Investors are also tracking the asset's relative strength against Bitcoin after several multi-week attempts to form higher lows on short-term charts.
What Is Confirmed
Verified market data confirms multiple technical and institutional developments across spot and derivatives markets:
- Technical Indicators: On the 4-hour chart, Ethereum's relative strength index (RSI) stood at 61.02, sitting above its moving average of 59.68, while the moving average convergence divergence (MACD) line registered at 7.69 above its signal line of 6.19.
- Fibonacci Levels: Ethereum trades directly above the 0.618 Fibonacci retracement level at $1,872.84, calculated from the April high of $2,464.48 down to the June low of $1,507.14. Overhead resistance sits at the 0.5 retracement level of $1,985.81.
- Liquidation Pools: CoinGlass derivative data indicates concentrated short-position liquidations between $1,920 and $1,950, totaling $604 million if price crosses $1,997, alongside $735 million in long liquidation risk if prices slide below $1,821.
- Institutional Filings: Fidelity filed to incorporate staking features into its spot Ethereum ETF (FETH), proposing to stake up to 100% of its reserve of more than 480,000 ETH (valued near $880 million) and pay quarterly cash distributions to holders.
- Treasury Holdings: Bitmine Immersion Technologies expanded its treasury reserve to 5.82 million ETH, representing approximately 4.8% of the total circulating supply, while total network staking reached 41.4 million ETH (34.4% of total supply).

Bitmine bought another 9,926 ETH last week, extending a weekly streak since June 2025, and chairman Tom Lee told investors the ETH to BTC ratio has broken above a years long downtrend he reads as capital rotating back, as reported by CoinTelegraph.
What Is Unconfirmed
Despite short-term recovery signals, several key market outcomes remain unverified. Technical trend strength remains weak, with the daily average directional index (ADX) measuring 15.41—below the 20 to 25 threshold required to signal an established trend. Analysts caution that failure to clear the $1,945 to $1,986 zone could result in rejection back down toward the $1,875 support baseline. Furthermore, regulatory timelines for proposed staking integrations across spot ETFs remain under regulatory review without formal approval dates.
The Bigger Picture
Ethereum's current valuation of $1,900 leaves the network's market capitalization around $233 billion, still roughly 62% below its historic peak. The network continues to hold approximately 57% of all stablecoin issuance, while major wealth management platforms in the United States have started adding 1% to 4% cryptocurrency allocations containing ETH to model portfolios. The broader trajectory aligns with Ethereum Price Trends: Insights and Future Speculations as structural supply lockups through staking interact with macroeconomic liquidity.
Latest Status
Ethereum trades between $1,899 and $1,920 as buyers attempt to maintain support above the 200-day moving average. The immediate directional path hinges on whether trading volume can force a breakout above $1,945 toward $2,000, or whether downside liquidations drag spot valuations back toward the primary demand cluster between $1,800 and $1,850.
Frequently Asked Questions
What is the immediate price resistance for Ethereum?
Ethereum faces immediate chart resistance between $1,935 and $1,945, followed by the 0.5 Fibonacci retracement level at $1,985.81. A sustained move above these zones is required to challenge the psychological $2,000 mark.
What are the critical support levels to watch?
Primary short-term support rests at the 0.618 Fibonacci retracement level of $1,872.84. A breakdown below this level exposes deeper support clusters between $1,850 and $1,800.
How much Ethereum is currently locked in staking?
Verified blockchain data shows that over 41.4 million ETH is deposited in staking contracts, representing roughly 34.4% of Ethereum's total circulating supply.
Why are spot ETF staking filings important?
Filings by asset managers such as Fidelity propose staking underlying fund holdings to generate yield for shareholders. If approved, these structures could absorb spot market liquidity and offer quarterly cash returns to institutional participants.